Most fleet managers don’t realise that their fleet is losing $150,000 annually. Not to rising fuel prices, but to poor fuel data nobody’s tracking. Missing transactions, shared fuel cards, and 40 hours of monthly idling per vehicle add up to six figures in preventable costs. Yet fuel data quality rarely makes it onto the priority list.
Why Fuel Data Quality Matters for Fleets
Fuel is one of the top three operating expenses for most fleets. Even small inaccuracies, like missing transactions or incorrect odometer readings can cost thousands each month. For businesses managing fuel tax credits, ESG reporting or complex logistics, fuel data quality directly impacts financial performance, compliance standing and operational efficiency.
When your data is incomplete or inconsistent, fraudulent behaviours go undetected, emissions reporting skews, and tax claims fail. Poor fuel data creates a cascading effect across finance, operations and sustainability. Yet most fleets don’t realise the full cost until they measure it.
5 Hidden Fuel Costs Draining Your Budget
1. Hidden Fleet Fuel Costs: Card Fraud and Pricing Errors
Fuel card misuse, fuel theft, and pricing discrepancies quietly drain fleet fuel budgets. Poor fuel data quality makes them invisible. When a fuel card shows Vehicle 47 filled up in Melbourne while telematics puts it 200km away in Geelong, you’ve caught fraudulent behaviour. But without automated geo-fence matching, that anomaly disappears into a spreadsheet alongside hundreds of legitimate transactions.
Missing or duplicated transactions make it difficult to reconcile invoices or verify discounts, leading to avoidable fuel overspend. Even a small percentage of errors can cost thousands each month.
The patterns are consistent across fleets:
- Shared PINs create plausible deniability when unauthorised fills occur. One operation found staff using fleet cards for personal fills: $800 a month for 10 months before anyone noticed.
- Duplicate transactions often slip through when the same fill up processes twice at the terminal. One duplicate might only be $150, but they compound quickly.
- Discount slippage happens when invoices charge a few cents above the contracted rate. 3 cents doesn't sound like much until it's $180,000 across a 50-asset fleet.
- "Fuel stretching" behaviours are harder to spot. Drivers topping up company tanks beyond capacity, then siphon excess into personal vehicles. Without tank capacity validation, it looks completely normal.
Each incident feels small: $50 here, $200 there. But when these patterns go unchecked, even a modest 3% leakage on a $750k annual fuel budget loses $22,500. That’s not a rounding error; that’s roughly 3 months of salary walking out the door every year.
2. Fuel Compliance Risks: BAS and FTC Audit Penalties
Incomplete or inconsistent fuel data increases the risk of errors in Fuel Tax Credits or BAS submissions. Inaccurate reporting exposes businesses to penalties, audits, and the time cost of rework. When your fuel records are messy, every BAS period becomes a risk event.
The ATO doesn’t accept “our data was messy” as an excuse.
FTC represent a significant monthly cash flow for most fleets. A 40-vehicle operation might claim $15-20k from FTC each month. But those claims require precise documentation: correct fuel type, verified business use and accurate volumes. When your fuel records can’t definitively prove all of these elements, you face a three-stage problem.
First, you under-claim. Missing or mis-categorised transactions mean you don’t claim credits you’re entitled to. If 5% of your diesel purchases lack proper documentation, you’re voluntarily leaving $9-12k a year on the table.
Second, you attract scrutiny. The ATO’s data-matching capabilities are sophisticated. When your BAS shows $65k in fuel purchases but your FTC claim only covers $58k, that discrepancy flags for review. Even if everything is legitimate, you may spend 20-40 hours gathering evidence and responding to queries. That’s up to a full working week dedicated just to correcting claims, each reporting period spent correcting what should have been originally.
Third, penalties escalate. Inaccurate claims can trigger penalties of up to 75% of the shortfall plus any interest. If your poor fuel data quality leads to $12,000 in over-claimed credits, you could face a further $9,000 in penalties on top of the increasing repayment. Repeated errors signal “failure to take reasonable care”, pushing penalties even higher and increasing the likelihood of reviews across multiple reporting periods and/or years.
3. Operational Costs of Poor Fleet Fuel Data
Manual reconciliation of card feeds, telematics data and invoices consume valuable administrative time. Maintenance schedules can slip when odometer readings are unreliable, and poor data visibility delays key decisions like route optimisation or supplier management.
Your teams are doing work that computers should and could be doing – and it’s costing you more than the salary line suggests.
Picture a typical month-end close. Finance receives fuel card statements with 800 transactions. Telematics exports show GPS data. Supplier invoices arrive in different formats. Someone now has to manually match these sources, investigate discrepancies, and produce a reconciled fuel report.
When data aligns cleanly, a skilled administrator can reconcile 50-75 transactions per hour, that’s 2 days’ work for an 800-transaction fleet. But the thing is, clean data is rare: when asset IDs don’t match across systems, reconciliation turns into detective work. Time doubles or triples, and suddenly you’re spending $1000-1500 per month on data matching that should align automatically.
The bigger cost is what doesn't happen:
- Maintenance schedules slip. Odometer readings are manually entered at fuel stops, and typos confuse your maintenance system, so triggers are late or not at all, turning a scheduled service into a breakdown nightmare.
- Route optimisation stalls. You want to analyse which routes have the worst fuel economy, but when 15% of transactions lack GPS validation, you can't reliably tie consumption to specific routes, so the analysis gets shelved, and the inefficiency persists.
- Supplier negotiation weakened. When invoicing doesn't consistently match transaction records, you walk into fuel contract renewals with incomplete data and end up accepting their numbers, leaving 2-3 cents per litre gap on 200,000L a year or roughly $5k in lost savings.
Every hour spent reconciling fuel data is an hour not spent analysing it for improvement opportunities.
4. Fleet Idling Costs: The Hidden $35k Annual Expense
Idling is one of the biggest hidden inefficiencies in fleet operations, and the easiest to miss. Across our customer base, vehicles idle for an average of 40 hours per month. That’s nearly a full work week of engine time producing zero productivity. For a 40-vehicle fleet, that’s 1,600 hours monthly, translating into thousands of dollars in wasted fuel and unnecessary emissions that most fleet managers never see until they started measuring it.
How much does fleet idling cost? A diesel truck burns approximately 1L/hour when idling, that 1600 hours can quickly add up to almost $3000 per month for a 40-asset fleet. At $1.8/L, that’s $35,000 a year on fuel used on idling.
What makes idling so insidious is that it feels reasonable to drivers:
- "I'm keeping the cab cool while I do paperwork."
- "I'm only stopped for ten minutes."
- "The fridge unit needs power" (even when it doesn't).
- "The engine needs to warm up."
Individually, each reason sounds harmless, but when 40 of your drivers each idle for "just 10 minutes" per day, that's 140 hours of idle time per day fleet-wide. Small habits scale into large invisible fuel costs.
The impact goes well beyond fuel spend. Extended idling is harder on engines than highway driving, accelerating wear and shortening service intervals by 15-20%—often adding $1,200-$2,000 per vehicle per year in extra maintenance. Every litre burned while idling also produces about 2.6 kg of CO₂ with no productivity attached, quietly undermining your emissions and sustainability targets.
Most fleet managers are shocked when they first see their idling data. The gap between 40 hours a month (current state) and 8 hours a month (a typical target) is 32 hours of recoverable waste per vehicle, around $57 per vehicle per month, or more than $27,000 a year for a 40-vehicle fleet.
The upside: idling reduction is one of the cheapest fuel savings levers you have. Once you have visibility, simple steps like driver coaching, automated idling alerts, and monthly leaderboards routinely cut idling by 20–35% in the first quarter, improving fuel efficiency, reducing maintenance load, and strengthening your emissions story with almost no capital outlay.
5. Fleet Emissions Reporting Risks and ESG Compliance
Fuel data underpins Scope 1 emissions reporting. When the data is inaccurate, emissions totals are skewed, undermining sustainability goals and potentially misleading stakeholders. Poor data governance can damage trust and compliance standing.
Your sustainability report is only as credible as the fuel data behind it, and stakeholders are getting better at spotting the gaps.
Scope 1 emissions (direct emissions from owned vehicles) are calculated almost entirely from fuel consumption data. For most fleets, this represents 60-80% of total carbon footprint. When investors, customers, or regulators ask: "how do you know your emissions reduced by 8%?", the answer must be: "because our fuel data says so."
But what if your fuel data is incomplete?
Consider a reconciliation rate of 92%. That sounds strong until you realize 8% of fuel purchases aren't captured. If you consumed 500,000L annually, that's 40,000L unaccounted for. At 2.68kg CO₂ per litre of diesel, you've "lost" 107 tonnes of emissions from your reporting. Your sustainability report shows improvement, but you've simply missed data.
When an auditor or investor cross-references your financial fuel spend against reported consumption, the gap undermines everything.
The reputational risk is asymmetric:
- Accurate sustainability reporting with strong data governance equals baseline expectation.
- Inaccurate sustainability reporting discovered later equals greenwashing accusations and permanent credibility damage.
Multiple companies faced investor lawsuits and regulatory action in 2024 for ESG reporting discrepancies. The legal standard is shifting from "good faith effort" to "defensible accuracy with auditable systems." Your fuel data governance directly determines which side of that line you're on.
But there's an opportunity here: Fleets with high-quality fuel data don't just avoid reporting risk. They gain competitive advantage. Win tenders requiring verified emissions reporting. Participate in carbon offset programs requiring rigorous measurement standards. Some insurers now offer 5-10% premium reductions for fleets with strong ESG data governance.
Your fuel data is either a liability creating compliance risk, or an asset demonstrating environmental leadership. Poor data governance keeps you trapped in the first category, even if your actual emissions performance is strong. The good news: accurate fuel data is the foundation. Once you have it, everything else becomes straightforward.
The Business Case for Better Fuel Data
Poor fleet fuel data creates quantifiable losses that scale with fleet size. Here's what the typical fleet is leaving on the table:
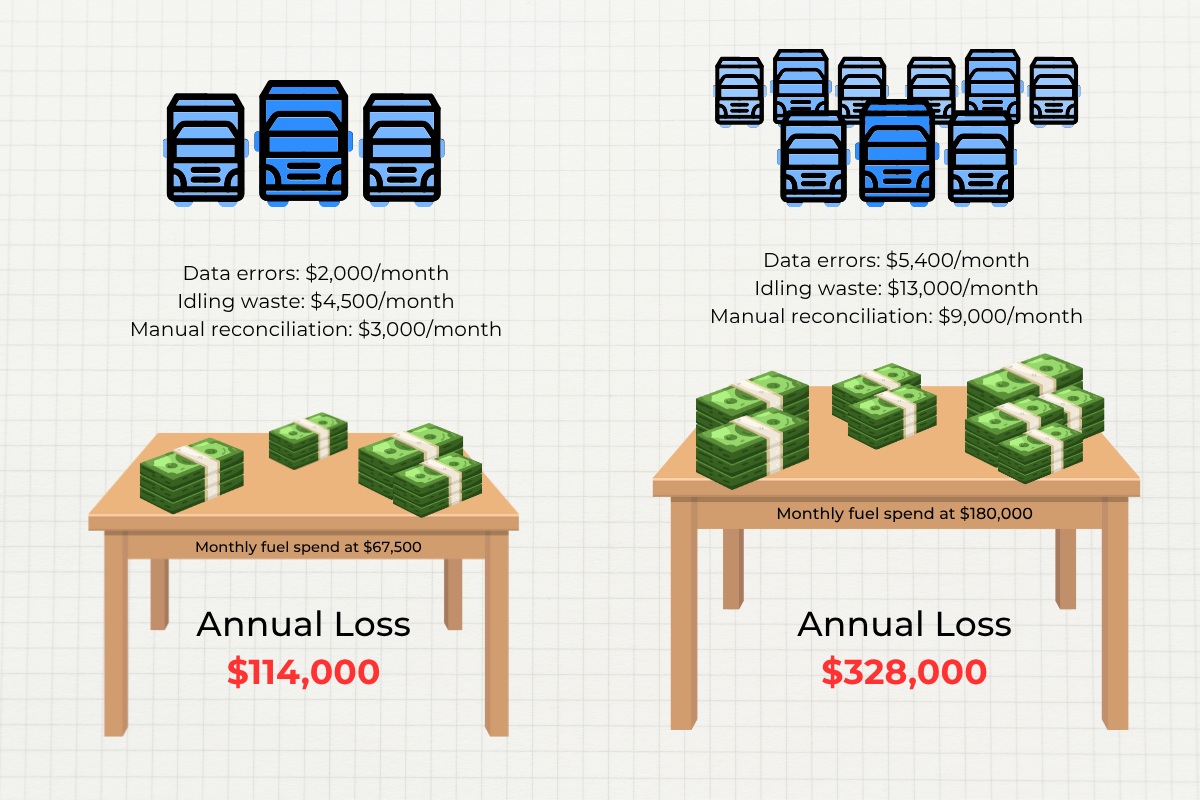
These numbers aren’t hypothetical. They’re based on patterns we see consistently across hundreds of fleets. The 3% error rate is conservative; many businesses discover 5-7% leakage once they implement proper tracking.
The question isn’t whether your fleet has these hidden costs. It’s whether you’re measuring them yet.
Is Your Fleet's Fuel Data Fit?
Fleet Fuel Data Health Check: 6 Critical Questions
- Are all transactions matched to a verified vehicle, driver and GPS locations?
- Are cards and PINs unique with restrictions by product, time, and volume?
- Do invoice prices reconcile with contract rates automatically?
- Is idling tracked and actively reduced (where possible) each month?
- Are FTC and BAS submissions generated from the same governed dataset?
- Does your business maintain the required 5-year digital audit trail?
If not, there’s likely more money leaking from your fuel budget. With risk accumulating under the surface.
Turning Fuel Data into a Competitive Advantage
Your fuel data already shows where the money is leaking, if you make it accurate, connected, and governed. The businesses that invest in their fleet’s fuel data analytics, automated reconciliation and idling reduction see immediate returns in fuel efficiency, compliance confidence, and sustainability performance.
But how do you actually fix poor fuel data? That’s where most fleet managers get stuck.
In Part 2, we’ll walk you through the exact 3-step framework we use to help fleets eliminate these hidden costs:
- How to standardise your fuel data pipeline
- How to automate data integrity and verification
- How to strengthen governance and accountability