Overview
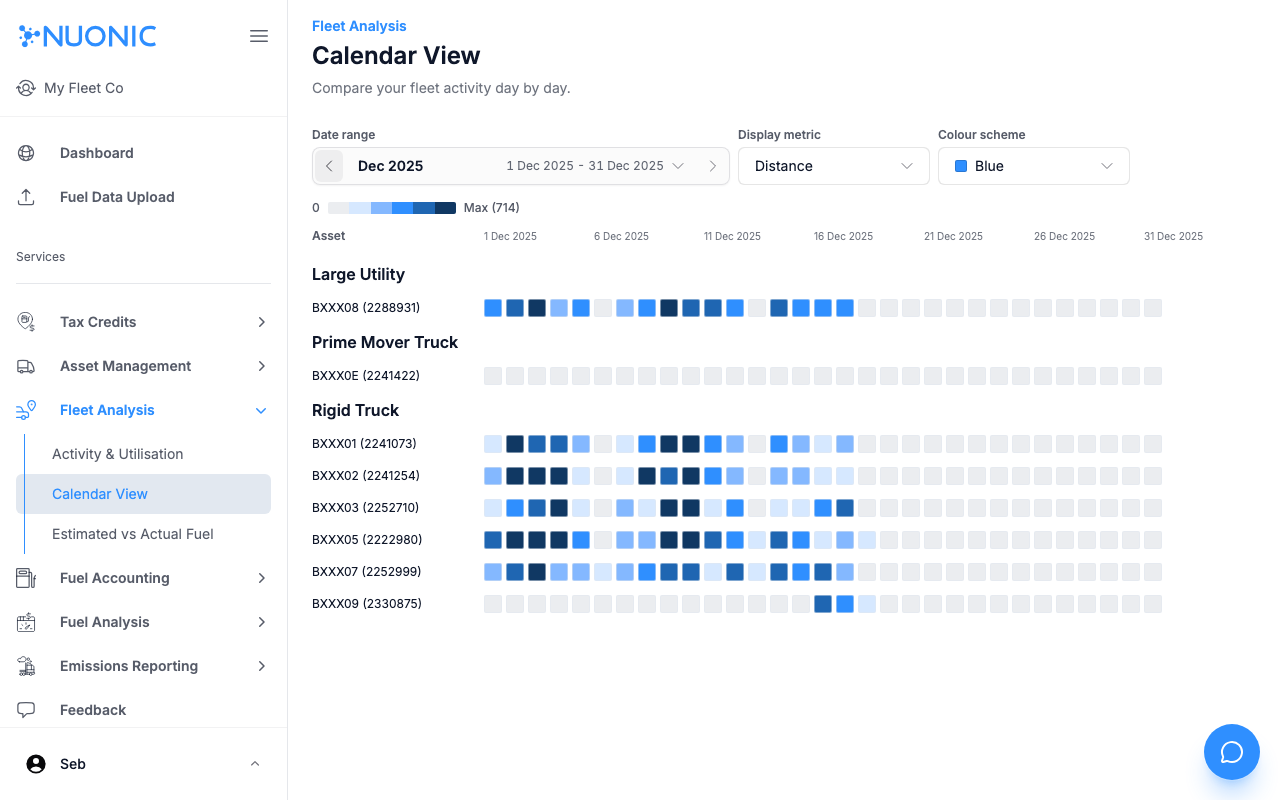
The Calendar View shows fleet activity for each asset day by day in a heatmap layout. Use it to spot patterns in vehicle usage, identify gaps in activity, and compare utilisation across your fleet over time.
Prerequisites
- You are logged in to Nuonic.
- Your GPS telematics provider is connected and supplying trip data.
Steps
- In the left sidebar, select
Fleet Analysis, thenCalendar View. - Set the
Date rangeto the period you want to review. - Use the
Display metricdropdown to choose what the heatmap shading represents (e.g.Distance). - Optionally change the
Colour schemeto suit your preference. - Review the calendar grid — darker cells indicate higher activity for that asset on that day.
Screenshots
The Calendar View groups assets by vehicle type and shows a day-by-day activity heatmap. Darker shading means more activity for that asset on that date.
Troubleshooting
- If the calendar is empty, confirm telematics data is connected and covers the selected date range.
- Assets with no GPS data will show no shading — check your telematics connection.