Overview
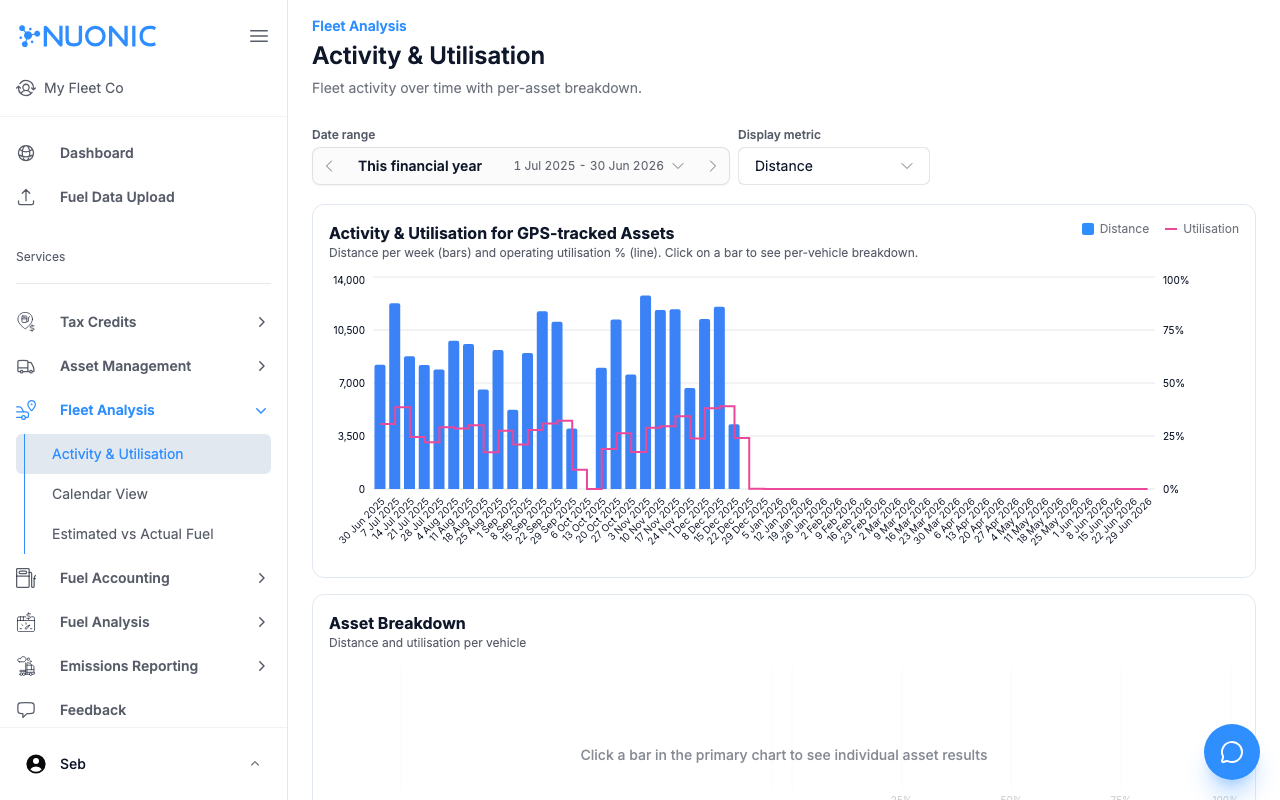
The Activity & Utilisation view shows fleet distance and operating utilisation over time, with a per-asset breakdown. Use it to identify underutilised vehicles and track fleet activity patterns week by week.
Prerequisites
- You are logged in to Nuonic.
- Your GPS telematics provider is connected and supplying trip data.
Steps
- In the left sidebar, select
Fleet Analysis, thenActivity & Utilisation. - Set the
Date rangeto the period you want to review. - Use the
Display metricdropdown to switch betweenDistanceand other available metrics. - Review the primary chart showing distance per week (bars) and utilisation % (line).
- Select a bar in the primary chart to see the per-asset breakdown in the
Asset Breakdownsection below.
Screenshots
The Activity & Utilisation page shows a weekly distance and utilisation chart at the top. Select any bar to drill down into per-asset results in the breakdown below.
Troubleshooting
- If no data appears, confirm your telematics provider is connected and trip data is being received.
- Try a wider date range — data may not exist for the current period if the connection is recent.