Overview
The Scoreboard shows your most and least costly assets, fuel cards, and fuelling locations at a glance for a selected period. Use it to quickly identify outliers in fleet fuel spend.
Prerequisites
- You are logged in to Nuonic.
- At least one fuel acquisition record has been uploaded.
Steps
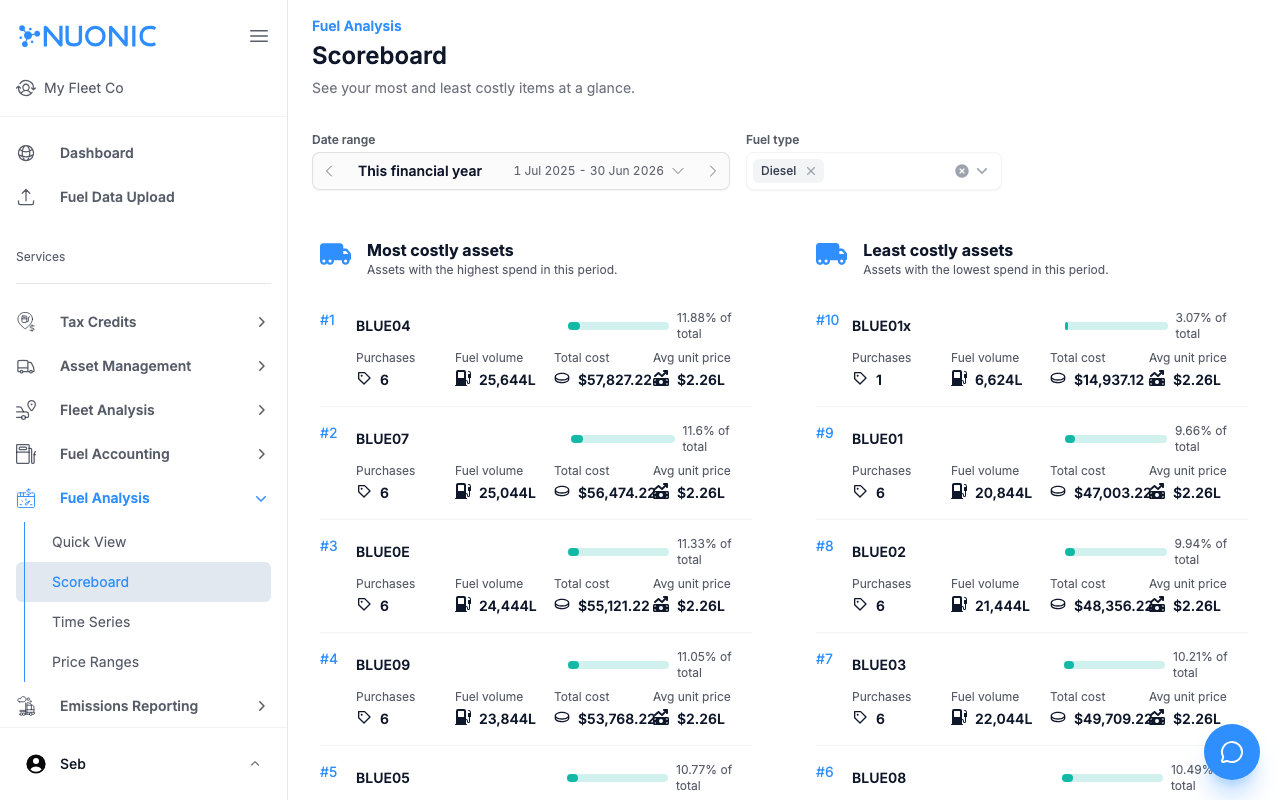
- In the left sidebar, select
Fuel Analysis, thenScoreboard. - Set the
Date rangeandFuel typefilters. - Review the rankings under
Most costly assets,Least costly assets,Most used cards,Least used cards,Most used locations, andLeast used locations.
Screenshots
The Scoreboard ranks assets, cards, and locations by fuel spend and usage for the selected period, making it easy to spot the highest and lowest performers.
Troubleshooting
- If cards or locations show no data, ensure your fuel records include card numbers or location data.
- Adjust the date range if results are empty.