Overview
Explore fuel spend, volume, purchases, unit price, taxes, and fees over time using the Time Series view in Fuel Analysis. Use it to identify spending trends and seasonal patterns across your fleet.
Prerequisites
- You are logged in to Nuonic.
- At least one fuel acquisition record has been uploaded.
Steps
- In the left sidebar, select
Fuel Analysis, thenTime Series. - Set the
Date rangeto the period you want to analyse. - Use the
Fuel typefilter to narrow results to a specific fuel (e.g. Diesel). - Review the charts for
Spend,Volume,Purchases,Unit Price,Taxes, andFees.
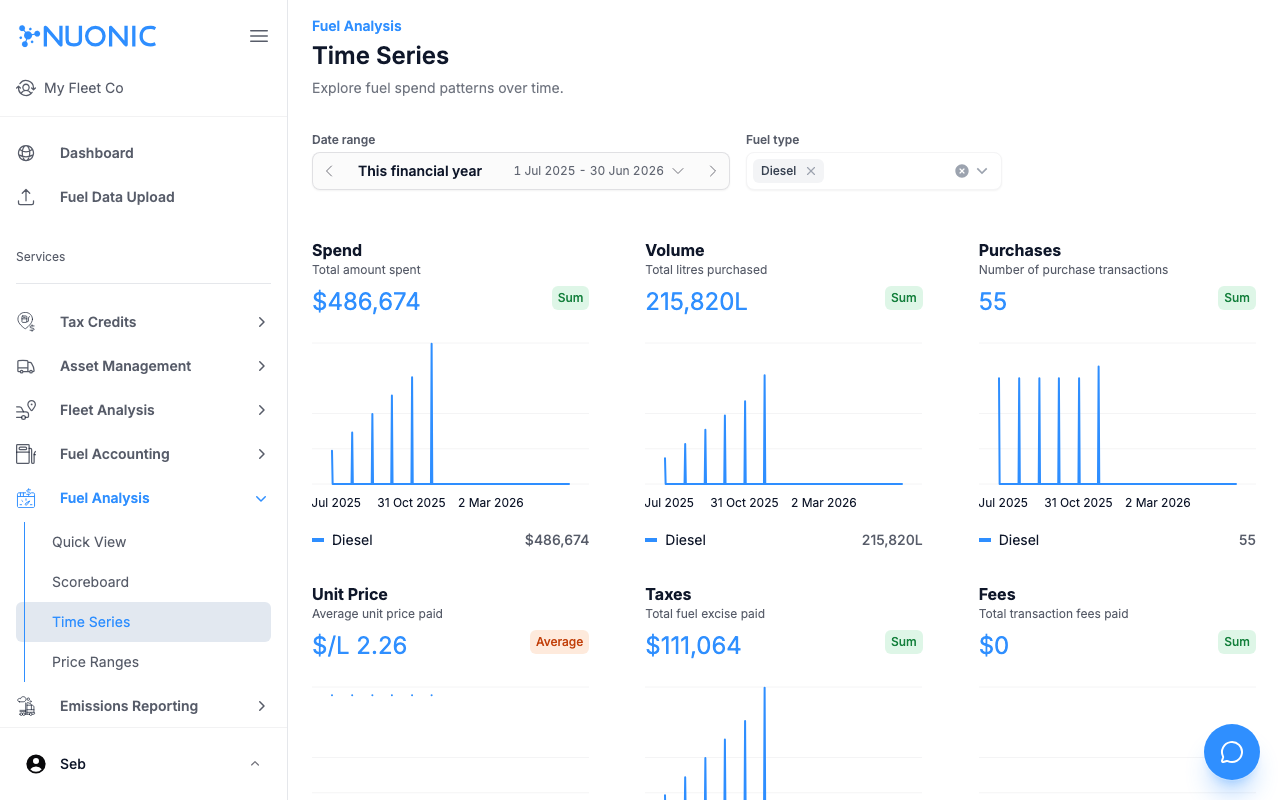
Screenshots
The Time Series page shows six metric charts across your selected date range and fuel type. Each chart shows a summary value at the top and a trend line below.
Troubleshooting
- If charts are empty, confirm fuel records exist for the selected date range and fuel type.
- Use
This financial yearas a starting point to see all available data.